Vereenvoudigde Samenvatting van dit artikel

Op verzoek van e-bike accuconsultant James Post heeft CALCE (electronics/lithium-ion testlaboratorium Universiteit van Maryland/USA) een studie uitgevoerd, inclusief praktische proef met 1.5Ah Lithium-Ion cellen om aan te tonen dat een gereduceerde SoC (laad/ontlaad) range degradatie minimaliseert en daarmee de levensduur verhoogt. Dit bevestigt eerder onderzoek en de praktijk in de EV-industrie, waar een verminderde SoC van typisch 20-80% fabrikanten in staat stelt tot 8 jaar pro rata garantie aan eindgebruikers aan te bieden.

Omdat het wetenschappelijke artikel niet gemakkelijk voor iedereen te begrijpen is, heeft James Post deze samenvatting van de resultaten, samengesteld, welke door Prof. Pecht, directeur van CALCE is goedgekeurd.

20-80% SoC (ont) laadbereik

Aangezien de test maakt gebruik van cellen, was celbalancering (vereist bij accupacks) niet nodig. Deze test gebruikt “coulomb tellen”: een exacte manier, in plaats van onnauwkeurig afschakelen bij een bepaalde spanning: SoC/Capaciteit = Spanning * Huidige * tijd.

In deze samenvatting gebruiken we de C/2 resultaten, die ongeveer overeen komen met hi-speed opladen en het gemiddelde Pedelec ontlaadvermogen: bij 11Ah 36V ongeveer 200W.

Meest relevante testresultaat

Na ca. 960 Ah cumulatieve ontlading (ongeveer 640 cycli) hebben de cellen, welke op- en ontladen zijn van 0-100% een restcapaciteit van 84% en de degradatie neemt aanzienlijk toe met de tijd. De 20-80% cellen eindigen met bijna 92%, een ca. factor 2 degradatieverschil.

Relatieve effecten van volledig laden en ontladen


Grafiek nr. 3

De blauwe lijn in de bovenstaande grafiek (0-60%) geeft bijna geen vermindering van de capaciteit na 600 Ah (400 equivalente volledige cycli). In vergelijking met het vorige 0-100% resultaat geeft dit aan dat volledige oplading de belangrijkste "schuldige" is. De grotere degradatie bij 40-100% bevestigt dit.

Opmerkingen

  • Bij 20-80% laad/ontlaadbereik is de levensduur ongeveer het dubbele dan bij 0-100%. Laden tot 80% is de dominante factor.
  • Het opladen tot 60% is nog beter, maar omdat het niet praktisch is om de actieradius nog meer te verminderen zouden we niet willen noemen als een formele aanbeveling.
  • Hoewel dit uit deze tests niet duidelijk blijkt, is het uit eerder onderzoek en de ervaring in andere sectoren (EV) bekend dat ontladen tot ≥ 20% gunstig is voor de levensduur.
  • Opladen tijdens opslag tot 50% is gunstig, zolang de batterij wordt opgeladen voordat 20% wordt bereikt. Dit is sterk afhankelijk van zelfontlading, die aanzienlijk verschilt tussen de diverse accu's, voornamelijk als gevolg van het elektronicaontwerp.
  • De impedantie en interne weerstand worden door volladen licht negatief beïnvloed
Aanbevelingen
  • Net zoals bij elektrische auto’s is opladen van e-bike accu’s tot 80% voordelig wanneer de actieradius nog aanvaardbaar is, vergeleken met 100%.
  • Opslag tussen 30% en 50% SoC is zeer gunstig in vergelijking met 80-100% (de situatie bij regelmatig volladen)


Conclusie: Deze aanbevelingen kunnen de levensduur minstens verdubbelen

Voor meer informatie in Nederland: http://www.ebikebatterysystems.com tel. 085-0020000

Publicatie in wetenschappelijke uitgave “Journal of Power Sources”

Na het opstellen van het rapport voor James Post, werd het als artikel gepubliceerd in het zeer gerespecteerde Journal of Power Sources. Hoewel in de gepubliceerde versie tekstuele wijzigingen zijn aangebracht, blijft de inhoud in essentie hetzelfde.

Aangezien de gepubliceerde versie auteursrechtelijk beschermd is, kunnen we het rapport niet als zodanig publiceren en beperken ons tot de introductie. Onder referentie Journal of Power Sources 327 (2016) 394-400 kunnen belanghebbenden een exemplaar bij Elsevier bestellen.

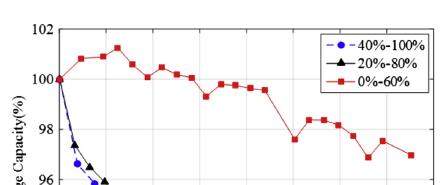
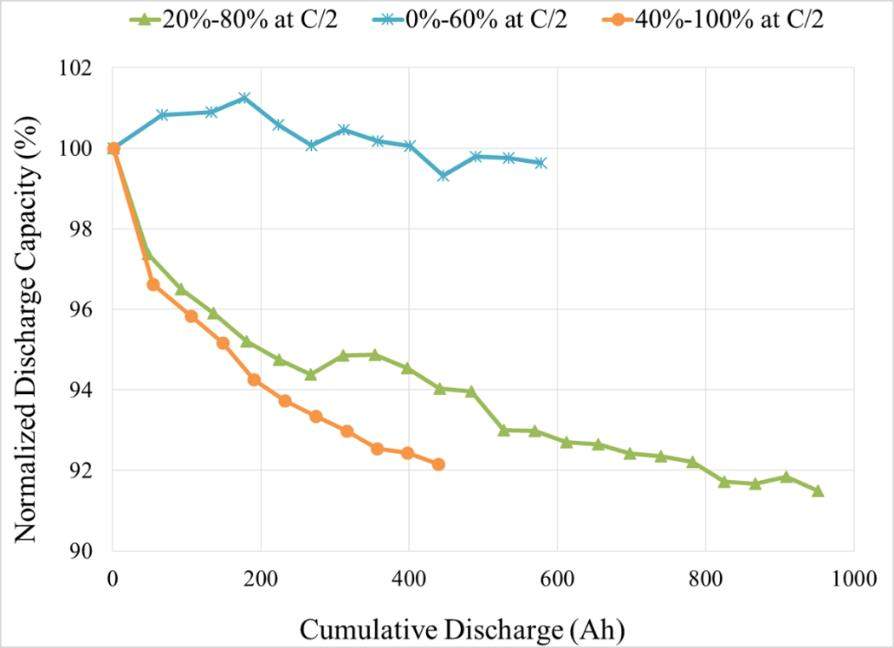
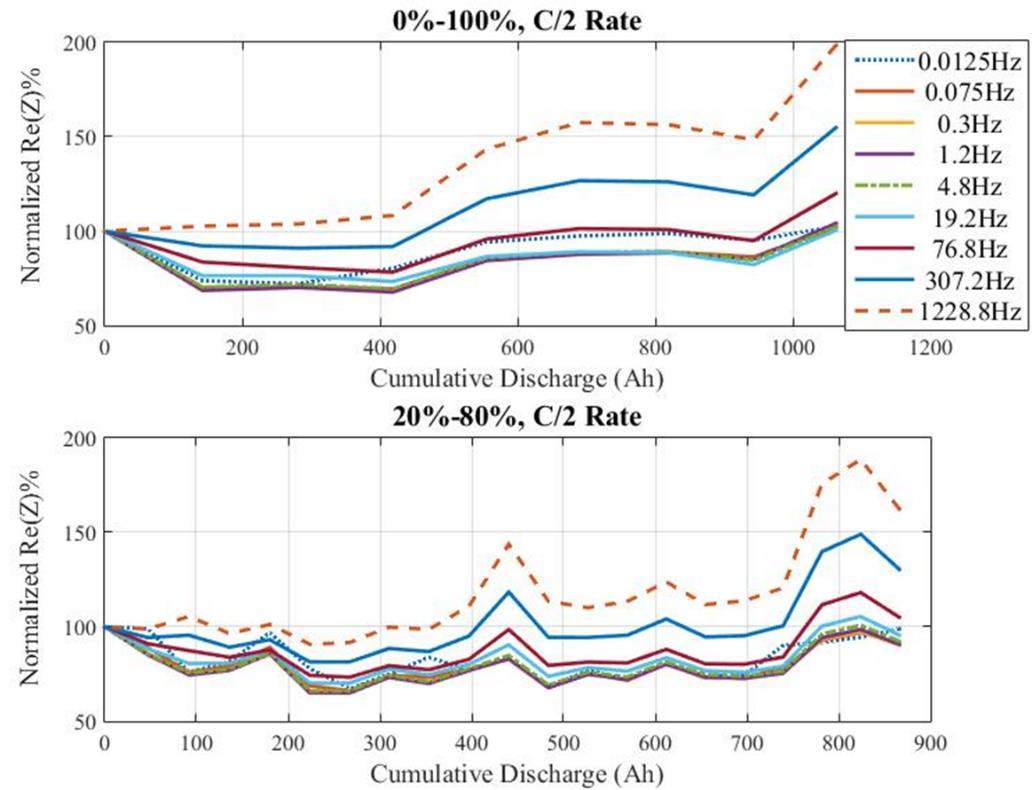
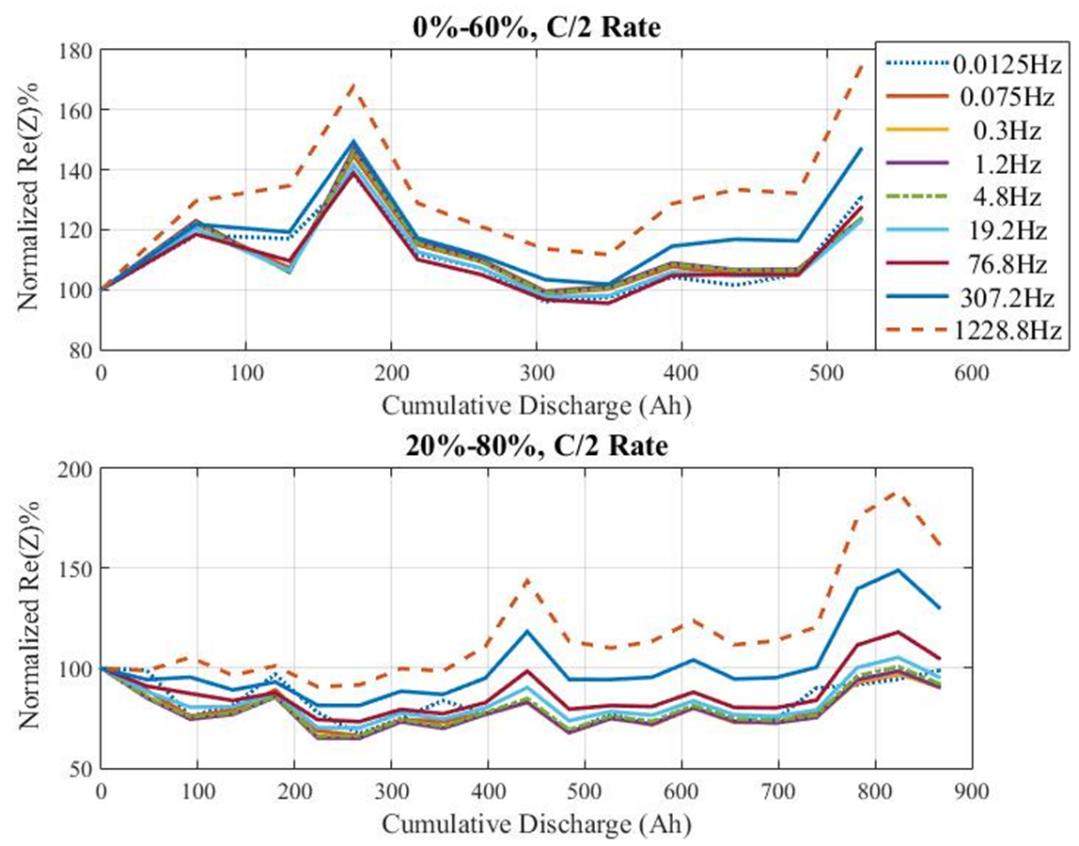
Nadat James Post het rapport ontving, werd de meeting voor 0-60% van grafiek nr. 4 uitgebreid, wat laat zien dat na 750 equivalente cycli, nog 97% van de originele capaciteit beschikbaar is!

(Source: Journal of Power Sources)

Het originele, volledige rapport:


Capacity Fade Modeling of Lithium-ion Batteries under Partial State of Charge (SOC) Cycling

Saurabh Saxena, Christopher Hendricks and Michael Pecht

Center for Advanced Life Cycle Engineering (CALCE)

University of Maryland, College Park, MD, 20742, USA

Abstract

This paper presents a methodology for modeling the capacity fade and identifying the optimal ranges of SOC for cycling of lithium-ion (LiCoO2) batteries to minimize degradation. Lithium-ion batteries are used in a variety of applications, and do not always undergo full charge and discharge cycling. This study will be very useful in understanding and quantifying the effect of partial charge-discharge cycling on li-ion battery capacity. LiCoO2 cells have been cycled for different SOC ranges and discharge currents to measure their capacity fade and impedance growth. The results are used to develop an empirical model of capacity fade of batteries under partial cycling conditions. The performance of this model is compared with other capacity fade models present in the literature. The optimal charge/discharge ranges obtained from this study can be combined with current SOC estimation methods for efficient life cycle and health management of lithium-ion batteries.

  • Introduction
Lithium-ion (Li-ion) batteries are a popular type of rechargeable battery due to their high specific energy and voltage, low maintenance, and absence of memory effect. Like other battery chemistries, Li-ion batteries are also undergo aging. There is an irreversible capacity loss associated with physical and chemical changes due to different usage conditions [1-2]. This capacity loss limits the lifetime of batteries and hinders their reliable operation in applications such as hybrid electric vehicles and renewable energy systems. Under certain operating conditions these failure mechanisms of batteries can result in catastrophic failure and safety issues as well.

Battery cycling reduces the capacity of a battery through a variety of failure mechanisms. Charge-discharge cycling of a battery puts mechanical stresses on the electrodes causing particle fracture, SEI layer cracking, and loss of particle connectivity [1-2]. Combined with electrochemical reactions between the electrodes and electrolyte, the cell gradually loses its energy storage capabilities [1, 3].  

In most practical applications, batteries undergo charge-discharge cycling only for partial SOC ranges as opposed to the full 0%–100% range. Hence, it is important to study the effects of partial range cycling on battery life.  Various studies [3-12] confirm that battery SOC is one of the stress factors responsible for the degradation of Li-ion batteries.  During the cycling of batteries, change in SOC (∆SOC) is also one of the parameters that limits the cycle life of batteries [5, 8-10].

Xie et al. [12] developed an anode stress model for LixC6-LiyMn2O4 cells during cycling. They reported that local stress in the anode particles decreased when the end-of-charge voltage was reduced from 4V to 3.8 V and in separate tests when lower cut-off voltage was increased from 2.8 V to 3.6 V during cycling. Since cell’s terminal voltage is related to the SOC as a function of open circuit voltage, ohmic contributions, and diffusion effects, the work suggests that the subjecting battery to very high and low SOC during cycling can accelerate degradation. Hoke et al. [11] used their charge power profile optimization [13] for lithium-ion batteries in electric vehicles to minimize the time spent by batteries between 70% to 90% SOC. Significant lifetime increase of nearly 4 years was achieved in simulation when the batteries spent majority of their operating time between 20% to 40% SOC as compared to 70% to 90% SOC during a typical weekly driving profile repeated over 20 years.
Watanabe et al. [14] investigated the cycle performance for LiAl0.10Ni0.76Co0.14O2 (NCA) cathode/graphite lithium-ion cells. Their study suggests that discharge capacity of battery was influenced by a change in the state of charge (∆SOC) during cycling. They cycled the cylindrical cells for 2500 cycles in two different voltage ranges of 4.2-2.5 V (0%-100% SOC) and 4.05-3.48 V (30% - 90% SOC) and found that batteries with reduced voltage range exhibited significantly less capacity fade. However, only one partial range of voltage is investigated in this study. Ning et al. [15] also found using simulation that the lower value of minimum SOC during cycling resulted in higher capacity fades. Hence, it is clear from the literature that maximum and minimum values of SOC and the change in SOC (∆SOC) during cycling can have a significant impact on battery lifetime and their performance.
Hall et al. [5] and Smith et al. [8] presented the lifetime modeling of lithium-ion cells under different temperature and depth of discharge (DOD) conditions. Millner [9] and Lam et al. [10] presented capacity fade models for LiFePO4 cells to quantify the effect of average SOC and deviation from average SOC during real operating conditions in electric vehicles. However, the validity of the results for other widely used electrode materials LiCoO2 has not been ascertained. Most of the models are derived only for specific usage conditions and suffer from small sample sizes.
In this paper, the capacity fade of LiCoO2 cells has been evaluated under the influence of different battery SOC maximum and minimum bounds, SOC ranges (∆SOC) and discharge currents. As the cells did not undergo full charge-discharge cycles, no. of cycles could not be properly defined [10]. Hence, cumulative discharge capacity of battery, which is a measure of total amount of charge delivered by the battery during a particular usage, is used for assessing the cycle life performance. The tests are conducted only at room temperature and effects of higher or lower temperatures on the capacity fade have not been investigated.
The rest of the paper is organized as follows: Section 2 outlines the experimental test procedure for performing initial characterization and the partial cycling study. Section 3 discusses the results from experimental testing and compares the measured capacity fade with the estimated capacity fade obtained from the model presented in [10]. Section 4 provides the conclusions from this work regarding the optimal cycling range and identifies the possible future areas of study.
  • Experimental Test Procedure
Commercial LiCoO2 cathode and graphite anode pouch cells with a nominal capacity of 1.5 Ah and a nominal voltage of 3.7 V were used in the study. The end-of-charge voltage of 4.2 V and end-of-discharge voltage of 2.75 V were specified by the manufacturer. The charging and discharging of cells were carried out using an Arbin BT2000 Battery Tester with 16 independent channels.

2.1 Initial characterization

As Li-ion batteries are used in electrical energy storage systems, various electrical parameters and characteristics are associated with them. These parameters and characteristics were determined initially to define standards for a comparison analysis later in this study. The determination of these parameters and characteristics also helped in checking the battery cells’ viability compared to the manufacturer specification sheet. This analysis was helpful in rejecting the samples that had a large deviation from the manufacturer specifications.

The initial characterisation tests for Li-ion cells included:

a) Constant current constant voltage (CCCV) charge-constant discharge-CCCV charge at C/2 rate

b) Open Circuit Voltage (OCV) vs. SOC characterization

c) Electrochemical impedance spectroscopy

d) X-rays and scanning electron microscopy (SEM) inspection

e) Electrode material characterization using energy dispersive spectroscopy (EDS)

  • Test Matrix
Different SOC ranges with different maximum and minimum SOC bounds were selected between 0% and 100% to understand the battery behaviour in different regions of full SOC range. The tests were conducted at two different discharge rates of 0.5C and 2C to evaluate the effect of discharge current on optimal SOC range. C-rate for a battery is defined as the ratio of battery current and maximum battery capacity. For 1.5 Ah test cells used in the study 0.5C and 2C rates refer to 0.75 A and 3A respectively. The data from the testing was used for modeling the capacity fade. The number of samples corresponding to a discharge rate and a SOC range was selected as keeping in mind the requirement of enough data points for finding the model constants at the same time avoiding the redundancy of data.
Table I: Test matrix for the study

Upper Limit of SOC

20%

40%

60%

80%

100%

Lower Limit of SOC

0%

-

-

2, 2

(0.5C, 2C)

2

(0.5C)

2, 2

(0.5C, 2C)

20%

NV*

-

2

(0.5C)

2, 2

(0.5C, 2C)

2

(0.5C)

40%

NV

NV

2, 2

(0.5C, 2C)

2

(0.5C)

2, 2

(0.5C, 2C)

60%

NV

NV

NV

-

-

80%

NV

NV

NV

NV

-

*NV-Not Valid Condition

  • SOC Estimation

The conventional Coulomb counting method was used to estimate the SOC of test cells during cycling. The SOC estimation was done using following equation:


                                    … (1)


Here, I is the current which is taken positive during discharge, t is the discharge time, and Q is the maximum discharge capacity of the battery. Due to the aging of the battery, the value of the discharge capacity continuously decreases. This method suffers from the cumulative error introduced due to change in capacity. The value of the maximum discharge capacity was determined after every 50 partial cycles by performing a full charge and discharge at 0.5 C. This was then updated in the algorithm to achieve an accurate estimation of SOC and to correctly maintain the same ranges of SOC (∆SOC) during the testing.
  • Partial Cycling Testing

Cells were initially charged to 100% SOC using the CCCV profile. After reaching 100% SOC, cells were discharged using constant C/2 current until they reached their minimum SOC limits (i.e. 20%) for the partial cycling. Constant current charge (always C/2) and constant current discharge (C/2 or 2C) were applied to the test cells for cycling between the desired maximum and minimum bounds of SOC (20% to 80%). Fig. 1 shows the current and voltage profiles for 20% to 80% SOC range and C/2 discharge current.

Fig. 1. Current and voltage profile for 20% to 80% SOC range cycling at C/2 rate.

During the constant current charge and constant current discharge for a time period calculated from SOC estimation method, it is possible that battery voltage may reach upper cut-off voltage (4.2 V) and lower cut-off voltage (2.7V) respectively. In that case the charge or discharge current need to be interrupted to avoid overvoltage or undervoltage condition. The battery SOC in that case will be slightly lower or higher than the desired SOC bounds.

These differences from the desired SOC bounds were taken care of by estimating the current SOC at the time of current interruption and by taking into account these variations in the calculation of the overall average SOC and SOC deviation during cycling.

The capacity fade data for the first 6-month period, obtained from partial cycling at all the SOC ranges mentioned in the test matrix, were used for fitting the capacity fade model.


Results and Discussion


The results from the long-term testing at different SOC ranges are shown in Fig. 2, 3 and 4. The normalized discharge capacity in the plot denotes the ratio of discharge capacity of a degraded battery and the initial battery discharge capacity. Cumulative discharge capacity is the total amount of charge delivered by the battery for a predefined period of operation. The failure criterion of capacity reduction to 80% of initial capacity was used in this study.


Fig. 2. Cumulative discharge capacity for (Average SOC = 50%, ∆SOC = 100%, 60%, 20%, C/2 rate).

Fig. 3. Cumulative discharge capacity for (Average SOC = 50%, ∆SOC = 100%, 60%, 20%, 2C rate).
From Fig. 2 and 3, it is evident that as the SOC range for cycling became smaller, the cumulative discharge capacity of the battery for same amount of capacity fade increased. For similar SOC ranges, higher cumulative discharge capacity was obtained by reducing the average value of battery SOC during cycling, as evident from Fig. 4.


Fig.4. Cumulative discharge capacity for (Average SOC = 30%, 50%, 70%, ∆SOC = 60%, C/2 rate).See update for 0-60%: page 3


Impedance measurements of cells were also collected at regular intervals at 100% SOC conditions. Results for the impedance spectrum are presented in figure 5 and 6.

Fig. 5. Normalized real part of impedance for (Average SOC = 50%, ∆SOC = 100%, 60%, 20%, C/2 rate).


Fig. 6. Normalized real part of impedance for (Average SOC = 30%, 50%, ∆SOC = 60%, C/2 rate).

The high frequency part of impedance spectra suggest the ohmic resistance of battery. It can be seen that the impedance measurements corresponding to highest frequency of 1228.8 Hz were found to be increasing with cumulative discharge for all the SOC ranges. At lower frequencies no distinct increasing or decreasing trend was observed. Impedance measurements were taken using Idaho National Lab’s Impedance Measurement Box [16].
  • Conclusion

The results from this study suggest that battery degradation is affected by battery SOC as well as the difference in maximum and minimum values of SOC during cycling. The results coincide with the findings of other researchers in the literature. According to the results, the average SOC as well as the range of SOC during cycling should be minimized to reduce the capacity fade rate and achieve longer cycle life.


According to our findings, there exists an optimum value of average SOC around which the battery should be cycled within the optimal ∆SOC such as 0% to 60% to achieve higher life time and cumulative discharge capacity. These optimal ranges of SOC for the cycling of battery can be combined with SOC estimation methods to manage the life of batteries in applications including electric vehicles and grid energy storage.


References

  • J. Vetter, P. Novak, M. R. Wagner, C. Veit, K. C. Moller, J. O. Besenhard, M. Winter, M. Wohlfahrt-Mehrens, C. Vogler, A. Hammouche, “Ageing mechanisms in lithium-ion batteries,” Journal of Power Sources, Vol. 147, pp. 269–281, 2005.
  • J. Christensen. J. Newman, “Stress generation and fracture in lithium insertion materials,” Journal of Solid State Electrochemistry, vol. 10, pp. 293–319, 2006.
  • M. Broussely, P. Biensan, F. Bonhomme, Ph. Blanchard, S. Herreyre, K. Nechev, R.J. Staniewicz, “Main aging mechanisms in Li ion batteries,” Journal of Power Sources, Vol. 146, pp. 90–96, 2005.
  • I. Bloom, B. W. Cole, J. J. Sohn, S. A. Jones, E.G. Polzin, B. S. Vattaglia, G. L. Henriksen, C. Motloch, R. Richardson, T. Unkelhaeuser, D. Ingersoll, H. L. Case, “ An accelerated calendar and cycle life study of li-ion cells,” Journal of Power Sources, Vol. 101, pp. 238-247, 2001.
  • J. C. Hall, T. Lin, and G. Brown, “Decay processes and life predictions for lithium-ion satellite cells,” in Proc. Of 4th International Energy Conversion Engineering Conference and Exhibit (IECEC), San Diego, U.S.A., 2006.
  • J. Belt, V. Utgikar, I. Bloom “ Calendar and PHEV cycle life aging of high-energy, lithium-ion cells containing blended spinel and layered-oxide cathodes,” Journal of Power Sources, Vol. 196, pp. 10213-10221, 2011.
  • M. Ecker, J. B. Gerschler, J. Vogel, S. Käbitz, F. Hust, P. Dechent, D. U. Sauer “ Development of a lifetime model for lithium-ion batteries based on extended accelerated aging test data,” Journal of Power Sources, Vol. 215, pp. 248-257, 2012.
  • K. Smith, M. Earleywine, E.Wood, and A. Pesaran, “Battery wear from disparate duty-cycles: opportunities for electric-drive vehicle battery health management,” in Proc. of American Control Conference, Canada, pp. 1-8, 2012.
  • A. Millner, “Modeling lithium Ion battery degradation in electric vehicles,” in Proc. IEEE Conf. Innov. Technol. Efficient, Rel. Electr. Supply, Waltham, MA, pp. 349–356, 2010.
  • L. Lam and P. Bauer, “Practical Capacity Fading Model for Li-Ion Battery Cells in Electric Vehicles,” IEEE Trans. on Power Electronics, vol. 28, no. 12, 2013.
  • A. Hoke, A. Brissette, D. Maksimović, D. Kelly, A. Pratt, D. Boundy, “Maximizing lithium ion vehicle battery life through optimized partial charging,” in Proc. of IEEE Innovative Smart Grid Technologies (ISGT), Washington, DC, pp. 1-5, 2013.
  • Y. Xie, C. Yuan, “An integrated anode stress model for commercial LixC6-LiyMn2O4 battery during the cycling operation,” Journal of Power Sources, Vol. 274, pp. 101-113, 2015.
  • A. Hoke, A. Brissette, D. Maksimović, A. Pratt, K. Smith, “Electric vehicle charge optimization including effects of lithium-ion battery degradation,” in Proc. of IEEE Vehicle Power and Propulsion Conference (VPPC), Chicago, IL, pp. 1-8, 2011.
  • S. Watanabe, M. Kinoshita, T. Hosokawa, K. Morigaki, K. Nakura, “Capacity fade of LiAlyNi1-x-yCoxO2 cathode for lithium-ion batteries during accelerated calendar and cycle life tests (surface analysis of LiAlyNi1-x-yCoxO2 cathode after cycle tests in restricted depth of discharge ranges),” Journal of Power Sources, Vol. 258, pp. 210-217, 2014.
  • G. Ning and B. N. Popov, “Cycle life modeling of lithium-ion batteries,” Journal of Electrochemical Society, vol. 151, no. 10, pp. A1584–A1591, 2004.
  • Impedance Measurement Box Working toward an Energy Storage Monitoring System Idaho National Laboratory. Available at:
  • http://www4vip.inl.gov/research/impedance-measurement-box/ (accessed on 27th August 2015)